Command Center
Last updated: June 2, 2026
Command Center
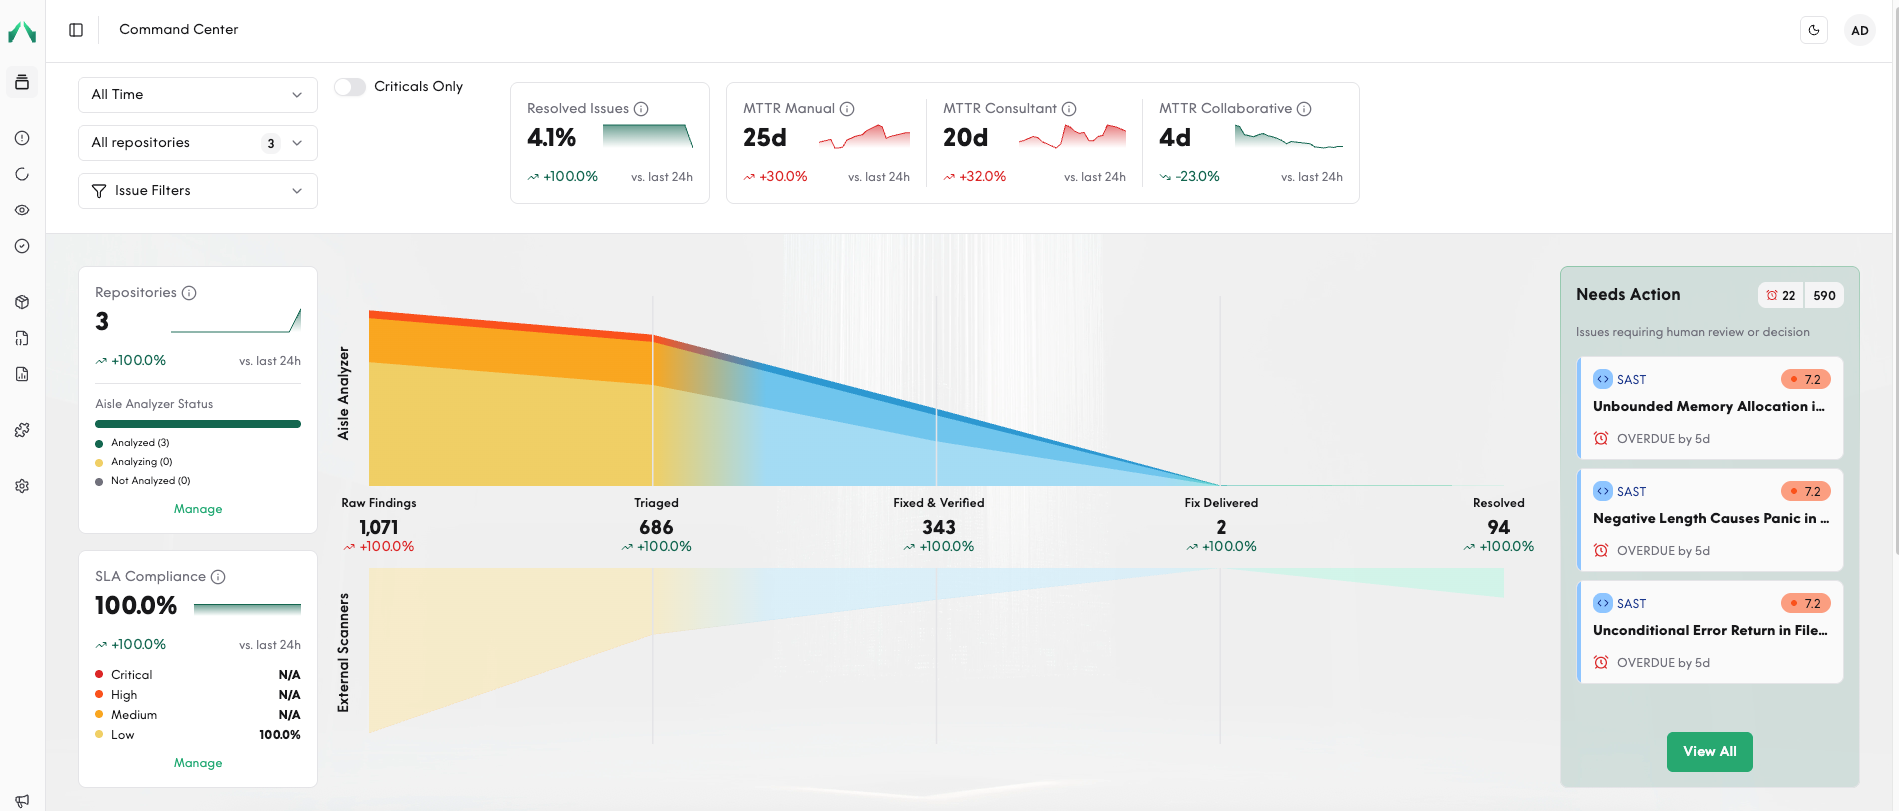
The Command Center is where you can see all your findings, monitor triage, and verify that you’re meeting your SLAs. It’s designed for security practitioners who want to act on remediation issues as well as leaders and CISOs who want a managerial overview of their entire pipeline.
Executive Security Metrics
At the top of the Command Center, four key performance indicators provide immediate visibility into your application risk and your security program's effectiveness:
1. Resolved Issues: Displays the percentage of security findings that have been successfully remediated. This metric directly reflects AISLE's effectiveness in reducing attack surface and managing technical security debt.
2. MTTR Manual: Tracks the mean time to resolution for security vulnerabilities when development teams work independently to fix issues. In this mode, human oversight is required for all actions - the system only performs automated detection and prioritization/triage. Developers maintain complete human control over the remediation process, requiring manual approval for all fixes.
3. MTTR Consultant: Tracks the mean time to resolution when the AI agent suggests fixes with detailed explanations, but human review and approval are required before implementation. In this mode, the system provides AI-powered fix recommendations, detailed remediation explanations, and risk assessment and impact analysis; however, human approval is still required before any changes are made to the codebase.
4. MTTR Collaborative: Tracks the mean time to resolution when AI agents create and test fixes automatically, then create pull requests for human review before merging. We recommend using this mode. It features automated fix generation and testing, pull request creation with detailed context, automated testing validation, and human review required for merging to balance automation efficiency with human oversight at the final deployment stage.
Needs Action
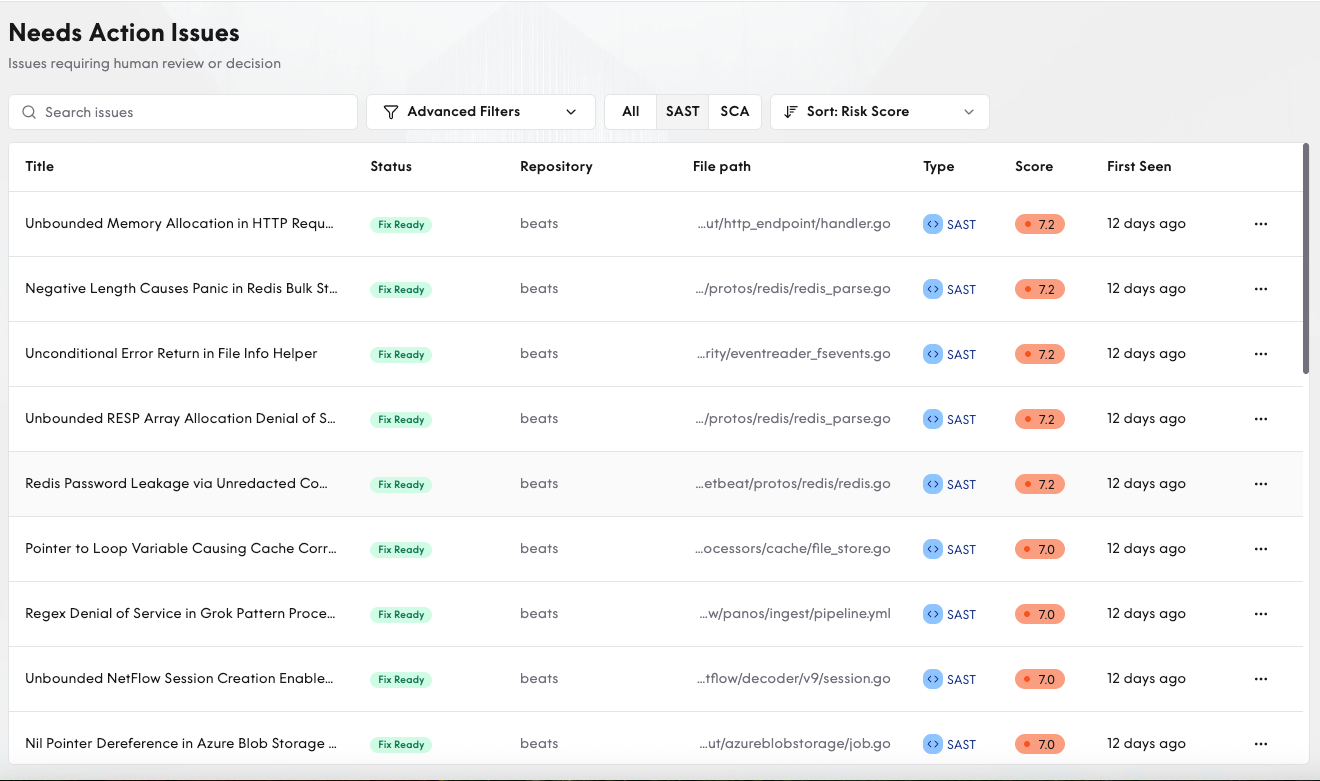
The “Needs Action” area presents all the issues that require human intervention. These vary based on your autonomy level. Click View All to see a full list of actions requiring your attention. You can then choose to view only SAST, SCA, Secrets or filter by repository.
Filters
At the top left, you can filter results by time, repository, severity level, issue type, and source tool.
Issue Status Overview
This area presents a brief overview of the issues in your pipeline. By selecting Go to Issues Board at the very bottom of the Command Center, you can view a kanban-style breakdown.
